
WTI crude oil price chart 2020
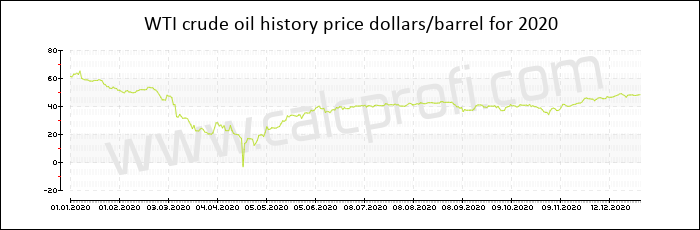
Price of WTI crude oil in 2020
| Date | Dollars per barrel |
|---|---|
| December 2020 | 48.520000 |
| November 2020 | 45.240000 |
| October 2020 | 35.790000 |
| September 2020 | 40.030000 |
| August 2020 | 42.860000 |
| July 2020 | 40.270000 |
| June 2020 | 39.730000 |
| May 2020 | 35.230000 |
| April 2020 | 19.380000 |
| March 2020 | 20.170000 |
| February 2020 | 44.760000 |
| January 2020 | 51.560000 |
|
| |||||||||||||
|
| |||||||||||||
|
| |||||||||||||
|
| |||||||||||||
|
| |||||||||||||
|
| |||||||||||||
|
| Found error? Any suggestions? Inform us | |