
WTI crude oil price chart 2014
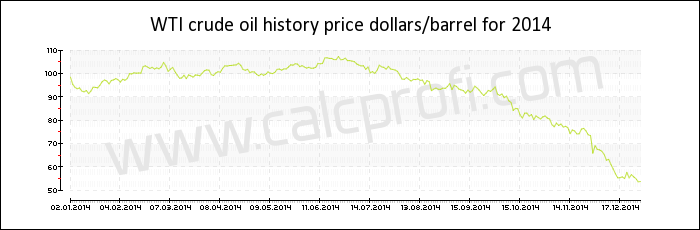
Price of WTI crude oil in 2014
| Date | Dollars per barrel |
|---|---|
| December 2014 | 53.870000 |
| November 2014 | 66.000000 |
| October 2014 | 81.040000 |
| September 2014 | 91.360000 |
| August 2014 | 94.560000 |
| July 2014 | 97.700000 |
| June 2014 | 105.440000 |
| May 2014 | 103.510000 |
| April 2014 | 99.720000 |
| March 2014 | 101.530000 |
| February 2014 | 102.150000 |
| January 2014 | 97.970000 |
|
| |||||||||||||
|
| |||||||||||||
|
| |||||||||||||
|
| |||||||||||||
|
| |||||||||||||
|
| |||||||||||||
|
| Found error? Any suggestions? Inform us | |