
WTI crude oil price chart 1997
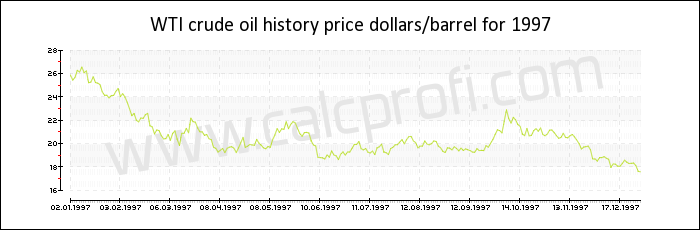
Price of WTI crude oil in 1997
| Date | Dollars per barrel |
|---|---|
| December 1997 | 17.600000 |
| November 1997 | 18.700000 |
| October 1997 | 21.180000 |
| September 1997 | 21.130000 |
| August 1997 | 19.630000 |
| July 1997 | 20.000000 |
| June 1997 | 19.950000 |
| May 1997 | 20.960000 |
| April 1997 | 20.050000 |
| March 1997 | 20.440000 |
| February 1997 | 20.700000 |
| January 1997 | 24.740000 |
|
| |||||||||||||
|
| |||||||||||||
|
| |||||||||||||
|
| |||||||||||||
|
| |||||||||||||
|
| |||||||||||||
|
| Found error? Any suggestions? Inform us | |