
WTI crude oil price chart 1996
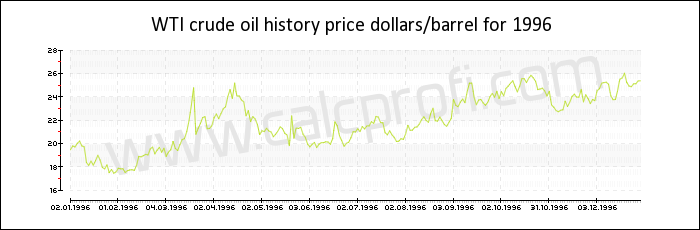
Price of WTI crude oil in 1996
| Date | Dollars per barrel |
|---|---|
| December 1996 | 25.400000 |
| November 1996 | 23.800000 |
| October 1996 | 23.330000 |
| September 1996 | 23.880000 |
| August 1996 | 22.180000 |
| July 1996 | 20.380000 |
| June 1996 | 21.020000 |
| May 1996 | 19.980000 |
| April 1996 | 20.800000 |
| March 1996 | 21.550000 |
| February 1996 | 19.620000 |
| January 1996 | 17.910000 |
|
| |||||||||||||
|
| |||||||||||||
|
| |||||||||||||
|
| |||||||||||||
|
| |||||||||||||
|
| |||||||||||||
|
| Found error? Any suggestions? Inform us | |