
WTI crude oil price chart 1988
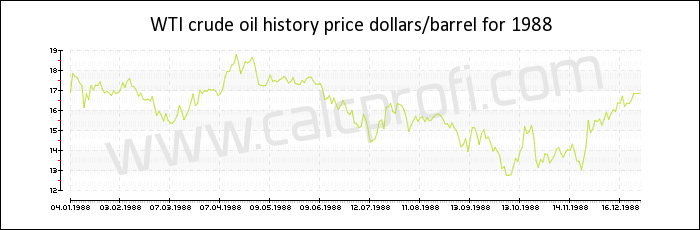
Price of WTI crude oil in 1988
| Date | Dollars per barrel |
|---|---|
| December 1988 | 16.870000 |
| November 1988 | 15.500000 |
| October 1988 | 13.380000 |
| September 1988 | 13.750000 |
| August 1988 | 15.130000 |
| July 1988 | 16.230000 |
| June 1988 | 15.330000 |
| May 1988 | 17.600000 |
| April 1988 | 17.780000 |
| March 1988 | 17.010000 |
| February 1988 | 15.760000 |
| January 1988 | 16.850000 |
|
| |||||||||||||
|
| |||||||||||||
|
| |||||||||||||
|
| |||||||||||||
|
| |||||||||||||
|
| |||||||||||||
|
| Found error? Any suggestions? Inform us | |