
Natural gas price chart for Europe 2018
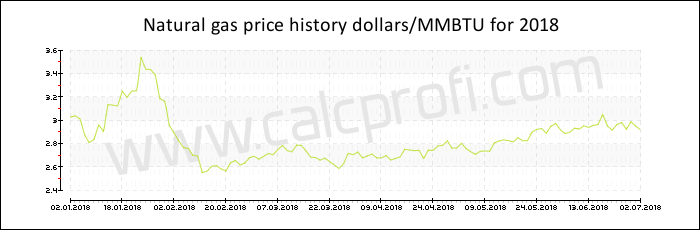
Price of natural gas in 2018
| Date | Dollars per Million Btu |
|---|---|
| December 2018 | 3.125000 |
| November 2018 | 4.584000 |
| October 2018 | 3.210000 |
| September 2018 | 3.057000 |
| August 2018 | 2.886000 |
| July 2018 | 2.801000 |
| June 2018 | 2.951000 |
| May 2018 | 2.891000 |
| April 2018 | 2.763000 |
| March 2018 | 2.706000 |
| February 2018 | 2.693000 |
| January 2018 | 3.165000 |
|
| |||||||||||||
|
| |||||||||||||
|
| |||||||||||||
|
| |||||||||||||
|
| |||||||||||||
|
| |||||||||||||
|
| Found error? Any suggestions? Inform us | |