
Natural gas price chart for Europe 2017
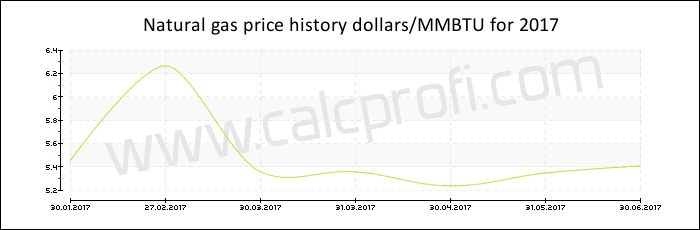
Price of natural gas in 2017
| Date | Dollars per Million Btu |
|---|---|
| December 2017 | 2.930000 |
| November 2017 | 3.175000 |
| October 2017 | 2.988000 |
| September 2017 | 3.022000 |
| August 2017 | 2.945000 |
| July 2017 | 2.900000 |
| June 2017 | 3.037000 |
| May 2017 | 3.146000 |
| April 2017 | 5.240000 |
| March 2017 | 3.199000 |
| February 2017 | 2.691000 |
| January 2017 | 3.224000 |
|
| |||||||||||||
|
| |||||||||||||
|
| |||||||||||||
|
| |||||||||||||
|
| |||||||||||||
|
| |||||||||||||
|
| Found error? Any suggestions? Inform us | |