
Natural gas price chart for Europe September 2016
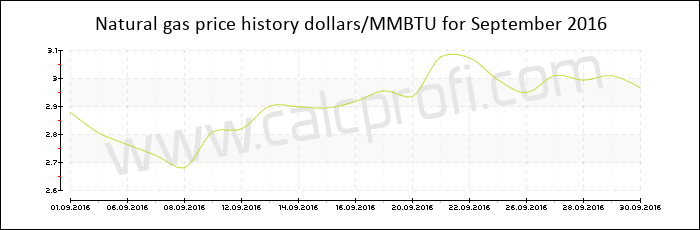
Price of natural gas in September 2016
| Date | Dollars per Million Btu |
|---|---|
| 30.09.2016 | 2.966000 |
| 29.09.2016 | 3.010000 |
| 28.09.2016 | 2.994000 |
| 27.09.2016 | 3.011000 |
| 26.09.2016 | 2.949000 |
| 23.09.2016 | 2.995000 |
| 22.09.2016 | 3.074000 |
| 21.09.2016 | 3.078000 |
| 20.09.2016 | 2.936000 |
| 19.09.2016 | 2.956000 |
| 16.09.2016 | 2.918000 |
| 15.09.2016 | 2.895000 |
| 14.09.2016 | 2.899000 |
| 13.09.2016 | 2.902000 |
| 12.09.2016 | 2.820000 |
| 09.09.2016 | 2.810000 |
| 08.09.2016 | 2.681000 |
| 07.09.2016 | 2.725000 |
| 06.09.2016 | 2.764000 |
| 02.09.2016 | 2.805000 |
| 01.09.2016 | 2.879000 |
|
| Found error? Any suggestions? Inform us | |