
Natural gas price chart for Europe May 2016
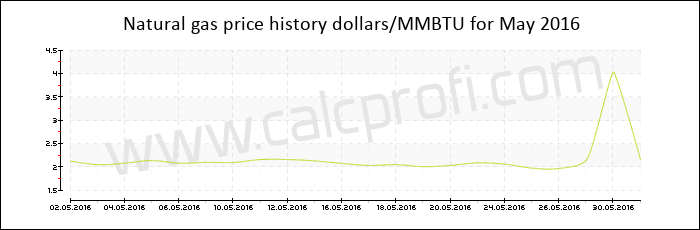
Price of natural gas in May 2016
| Date | Dollars per Million Btu |
|---|---|
| 31.05.2016 | 2.160000 |
| 30.05.2016 | 4.040000 |
| 27.05.2016 | 2.145000 |
| 26.05.2016 | 1.972000 |
| 25.05.2016 | 1.980000 |
| 24.05.2016 | 2.064000 |
| 23.05.2016 | 2.093000 |
| 20.05.2016 | 2.037000 |
| 19.05.2016 | 2.010000 |
| 18.05.2016 | 2.054000 |
| 17.05.2016 | 2.037000 |
| 16.05.2016 | 2.080000 |
| 13.05.2016 | 2.134000 |
| 12.05.2016 | 2.163000 |
| 11.05.2016 | 2.164000 |
| 10.05.2016 | 2.100000 |
| 09.05.2016 | 2.104000 |
| 06.05.2016 | 2.084000 |
| 05.05.2016 | 2.143000 |
| 04.05.2016 | 2.086000 |
| 03.05.2016 | 2.053000 |
| 02.05.2016 | 2.132000 |
|
| Found error? Any suggestions? Inform us | |