
Copper price chart for August 2016
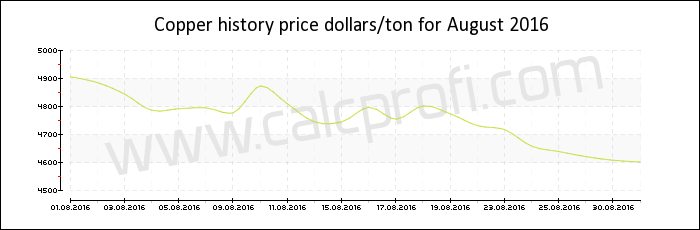
Price of copper in August 2016
| Date | Dollars per metric ton |
|---|---|
| 31.08.2016 | 4619.000000 |
| 30.08.2016 | 4602.000000 |
| 29.08.2016 | 4608.000000 |
| 25.08.2016 | 4621.000000 |
| 24.08.2016 | 4639.000000 |
| 23.08.2016 | 4658.000000 |
| 22.08.2016 | 4717.000000 |
| 21.08.2016 | 4731.500000 |
| 18.08.2016 | 4773.500000 |
| 17.08.2016 | 4802.000000 |
| 16.08.2016 | 4755.000000 |
| 15.08.2016 | 4797.000000 |
| 14.08.2016 | 4745.500000 |
| 11.08.2016 | 4745.000000 |
| 10.08.2016 | 4809.000000 |
| 09.08.2016 | 4873.500000 |
| 08.08.2016 | 4778.000000 |
| 07.08.2016 | 4795.000000 |
| 04.08.2016 | 4792.000000 |
| 03.08.2016 | 4786.500000 |
| 02.08.2016 | 4844.000000 |
| 01.08.2016 | 4885.000000 |
|
| Found error? Any suggestions? Inform us | |